 Exhibit
(c)(i) |
| Exhibit
(c)(i) |
 CONFIDENTIAL
- PRELIMINARY DRAFT -
SUBJECT TO FURTHER REVIEW Table of Contents 2 1. Executive Summary 2. Public Market Information 3. Preliminary Financial Analyses 4. Appendices Weighted Average Cost of Capital Calculation Illustrative Summary of Selected Implied Premiums Paid Observations Glossary of Selected Terms 5. Disclaimer |
 1. Executive Summary 2. Public Market Information 3. Preliminary Financial Analyses 4. Appendices 5. Disclaimer |
 CONFIDENTIAL
- PRELIMINARY DRAFT -
SUBJECT TO FURTHER REVIEW Executive Summary Process to date Public market backdrop Overview of preliminary financial analyses and selected key takeaways Key next deliverables for Houlihan Lokey Interim presentation on additional considerations related to a potential transaction
Final presentation as to whether the consideration to be received by the cashed-out
shareholders is fair; updated final presentation on additional
considerations related to a potential transaction provided at the same
time Other process items for Houlihan Lokey
Transaction structure due diligence; reflect terms of proposed transaction
Market updates Projections updates, if applicable Follow-up due diligence, if applicable Selected Finance and Strategic Planning Committee items Price determination Quantification of potential economic benefits of a “going-dark” transaction
Qualitative considerations of a potential transaction
4 |
 CONFIDENTIAL
- PRELIMINARY DRAFT -
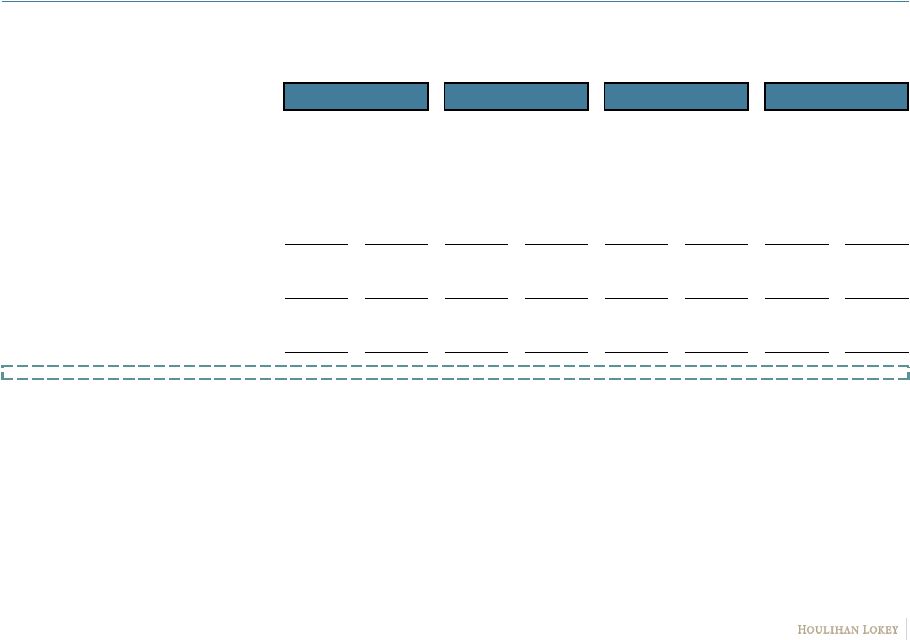
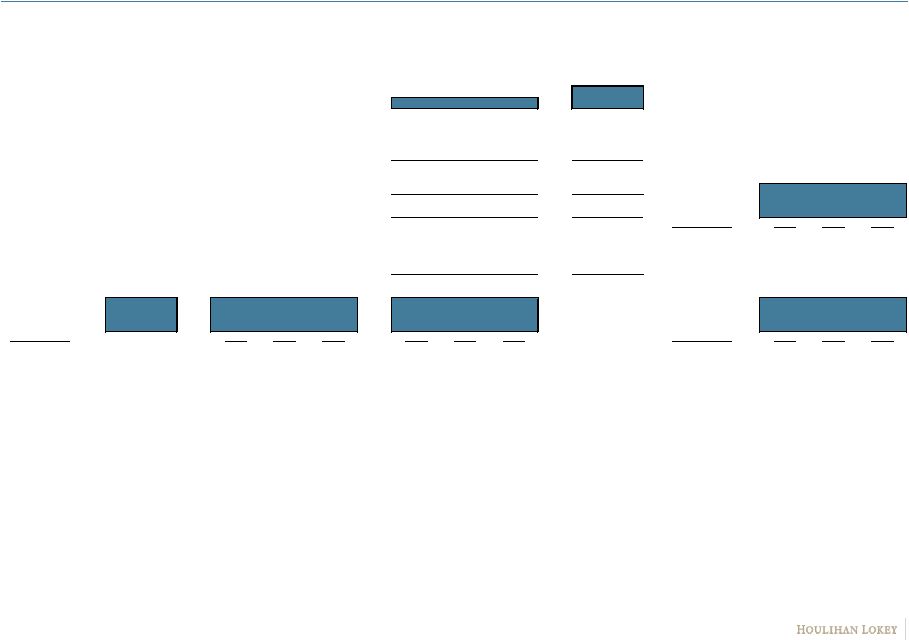
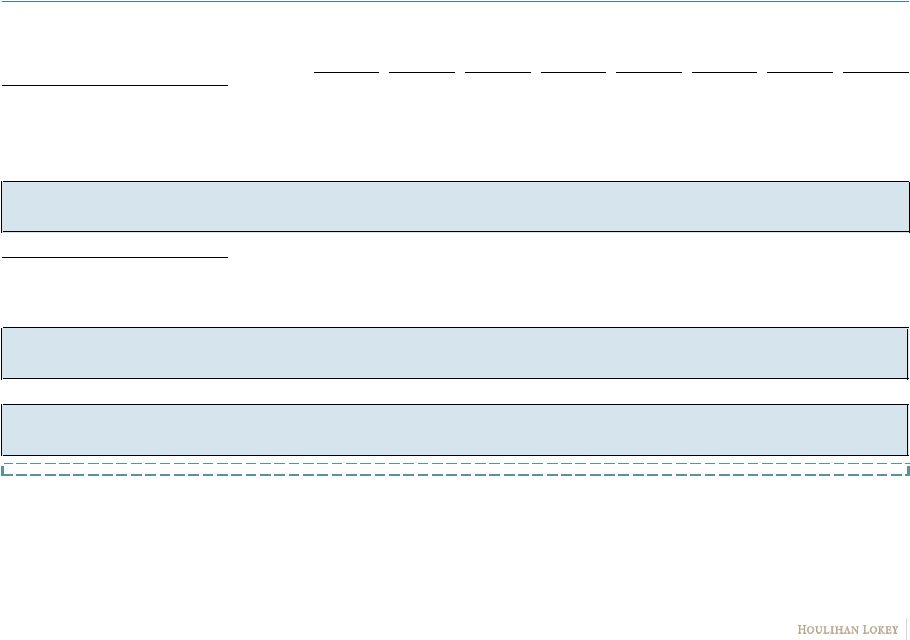
SUBJECT TO FURTHER REVIEW Financial Analyses Summary Note: No particular weight attributed to any analysis. Note: Shares and dilutive securities per Poconos management and public filings. Includes (i) 15.0 million shares outstanding as of 6/30/19 and
(ii) dilutive impact of 2.6 million warrants, to the extent in-the-money. Does not include dilutive impact of 0.4 million unvested options and 0.4 million unvested restricted stock units, per Poconos management. 1. Current Poconos per share price as of 8/20/19. 2. Post-restructuring intra-day high Poconos per share price observed on 5/9/19. As of 8/20/19.
Sources: Poconos projections per Poconos management, public filings and Capital IQ.
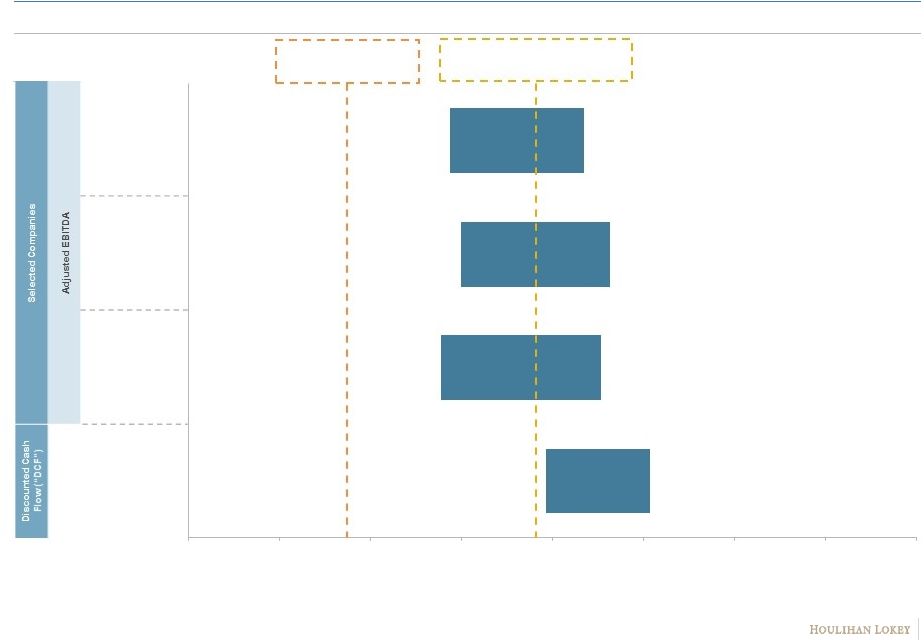
Poconos Implied Per Share Value Reference Range
LTM Ended 6/30/19 3.25x – 4.25x CY 2019E 3.00x – 4.00x CY 2020E 2.00x – 2.75x Terminal Multiple: 2.25x – 2.75x WACC: 12.5% – 13.5% Current Poconos Per Share Price 1 : $13.70 (dollars in actuals) $24.65 $18.84 $19.94 $19.33 $30.36 $27.65 $28.14 $26.71 $5.00 $10.00 $15.00 $20.00 $25.00 $30.00 $35.00 $40.00 $45.00 Post-Restructuring Poconos High Share Price 2 : $24.09 5 |
 1. Executive Summary 2. Public Market Information 3. Preliminary Financial Analyses 4. Appendices 5. Disclaimer |
 CONFIDENTIAL
- PRELIMINARY DRAFT -
SUBJECT TO FURTHER REVIEW
Historical VWAPs 10 Public Market Trading Overview (shares outstanding and dollars in millions, except per share values and where otherwise noted)
Trading Market Snapshot 1-Day 3-Day 5-Day 10-Day 15-Day 20-Day 30-Day 60-Day 90-Day 3-Month Since Re- Listing $13.70 $13.33 $12.31 $12.13 $13.30 $14.13 $15.48 $18.96 $19.45 $19.03 $19.26 (dollars per share) 1. Per the Company's Form 10-Q for the period ended 6/30/19. 2. Includes ~15.0 million shares outstanding as of 8/1/19. Potentially dilutive securities, including unvested stock options, unvested RSUs and
outstanding warrants, are not yet exercisable or are out-of-the-money. 3. Includes restricted cash balance of ~$2.0 million as of 6/30/19 returned to unrestricted cash and cash equivalents in August 2019 due to lower
than expected payments for professional fees incurred in connection with
corporate restructuring.
4. Per Capital IQ as of 8/20/19. 5. Reflects metric over applicable period subsequent to Poconos' corporate restructuring and re-listing on the New York Stock Exchange on
4/3/19. 6.
Per Bloomberg as of 8/20/19. Excludes computerized analysts.
7. Per public filings and Company releases. 8. Excludes from public float shares held by consenting stakeholders equitized as part of corporate restructuring (Värde Partners, Inc.; Brigade Capital Management, LP; Highbridge Capital Management LLC; and Whitebox Advisors, LLC), directors, officers and other insiders. 9. Reflects Imperial Capital estimates as of 8/20/19. 10.VWAP based on cumulative trading activity over the designated number of trading days (based on intraday trading).
Sources: Public filings and Company releases, Capital IQ, Bloomberg and equity
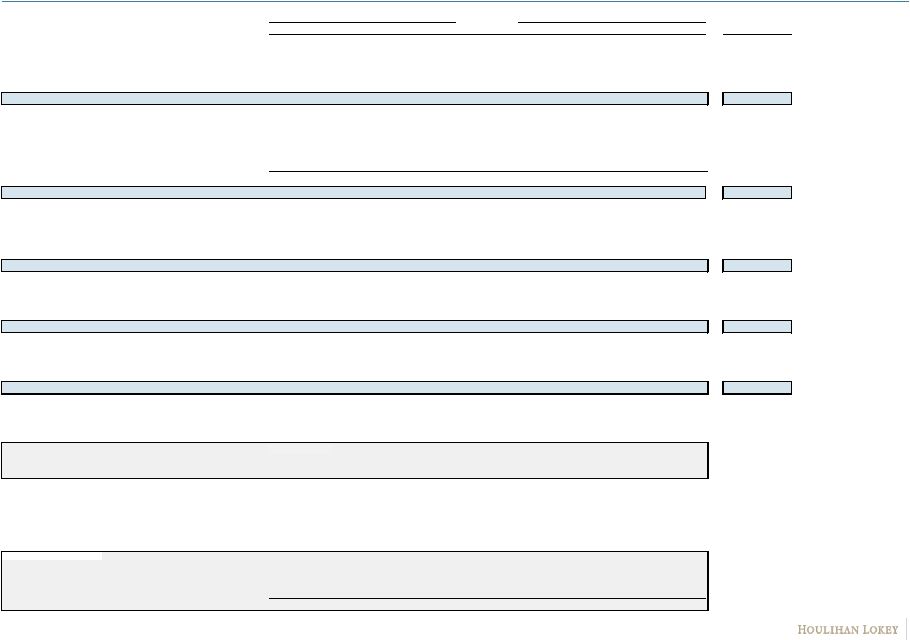
research. Public Market Enterprise Value Derivation
Selected Market Information as of August 20, 2019
Closing Stock Price August 20, 2019
$13.70 10-Day Average Trading Price [4] $12.41 Common Shares Outstanding [1] 15.0 1-Month Average Trading Price [4] $14.47 Dilutive Shares [1] [2] 0.0 3-Month Average Trading Price [4] $17.68 Fully Diluted Shares 15.0 All-Time High Trading Price [5] $24.09 Market Value of Equity $206.1 All-Time Low Trading Price [5] $10.67 Total Debt [1] 211.1 Cash and Cash Equivalents [1] [3] (141.1) 90-Day Average Daily Trading Volume (in shares) [4] 57,528 Public Market Enterprise Value $276.1 % of Total Shares Outstanding 0.4% 90-Day Average Daily Trading Value [4] $1.1 % of Market Value of Equity 0.5% Number of Analysts Covering the Company [6] 1 Total Public Float [7] [8] 3.7 % of Total Shares Outstanding 24.7% Implied Multiples LTM (6/30/19) [7] CY 2019E [9] CY 2020E [9] Enterprise Value / Revenue 0.5x 0.5x 0.4x Enterprise Value / Adjusted EBITDA 2.5x 2.3x 2.1x 7 |
 CONFIDENTIAL
- PRELIMINARY DRAFT -
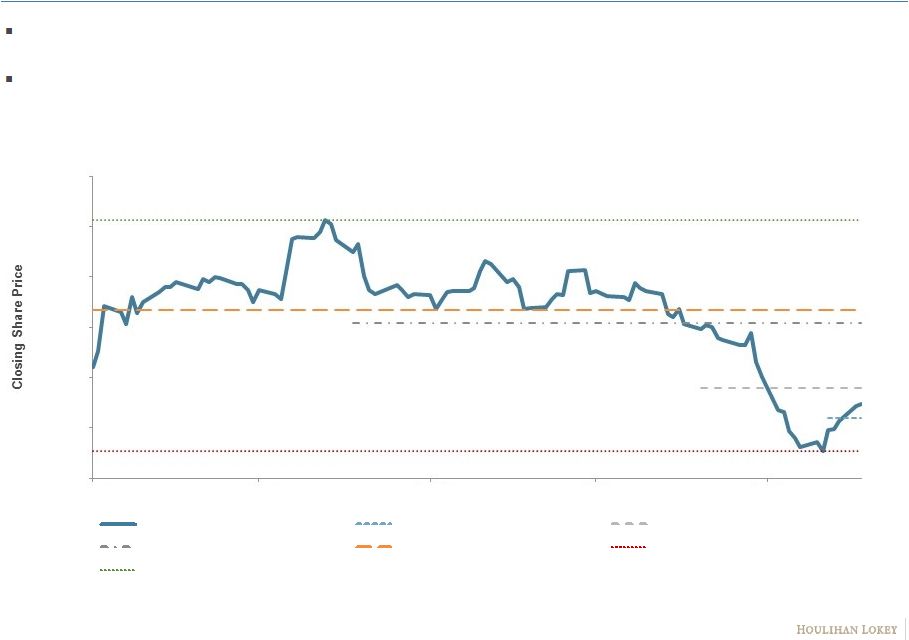
SUBJECT TO FURTHER REVIEW Stock Trading History Selected Trading Prices Since Re-Listing Source: Capital IQ as of 8/20/19. (dollars per share) Since the Company re-listed its shares on the New York Stock Exchange on April 3, 2019, its closing price per share has varied widely,
ranging from $22.83 on May 15, 2019 to $11.33 on August 13, 2019.
Recently, the Company’s per share price has fallen significantly,
reaching all-time lows subsequent to its emergence from restructuring
amidst broader oilfield services industry conditions.
$22.83 $11.33 $13.01 $13.70 $14.47 $17.68 $18.34 8 $10.00 $12.50 $15.00 $20.00 $22.50 $25.00 Apr-19 May-19 Jun-19 Jul-19 Aug-19 Poconos Closing Stock Price One Week Avg. Closing Price One-Month Avg. Closing Price Three-Month Avg. Closing Price Average Closing Price Since Re-Listing Low Closing Price Since Re-Listing High Closing Price Since Re-Listing $17.50 |
 CONFIDENTIAL
- PRELIMINARY DRAFT -
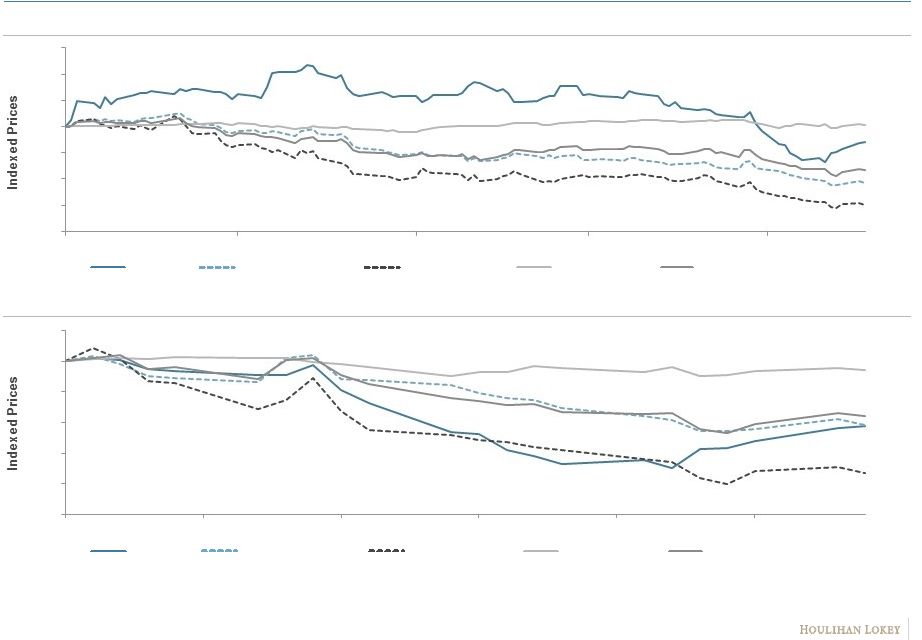
SUBJECT TO FURTHER REVIEW Relative Stock Performance Relative Performance (Since April 3, 2019 Re-Listing) 1. Drilling Services includes Ensign Energy Services Inc.; Helmerich & Payne, Inc.; Independence Contract Drilling, Inc.; Nabors Industries Ltd.; Patterson-UTI Energy, Inc.; PHX Energy Services Corp.; and Precision Drilling Corporation. 2. Rental Tool Services includes Basic Energy Services, Inc.; Frank’s International N.V.; Key Energy Services, Inc.; KLX Energy Services
Holdings, Inc.; and Superior Energy Services. Source: Capital IQ as of
8/20/19. Relative Performance
(Last Month) -33.0% 0.9% -11.6% -43.1% -59.7% -17.9% -2.8% -21.3% -20.9% -36.7% 9 20% 40% 60% 80% 100% 120% 140% 160% Apr-19 May-19 Jun-19 Jul-19 Aug-19 Poconos Drilling Services [1] Well Services [2] S&P 500 Index Oilfield Services Index (OSX) 50% 60% 70% 80% 90% 100% 110% Jul-19 Jul-19 Aug-19 Aug-19 Aug-19 Aug-19 Poconos Drilling Services [1] Well Services [2] S&P 500 Index Oilfield Services Index (OSX) |
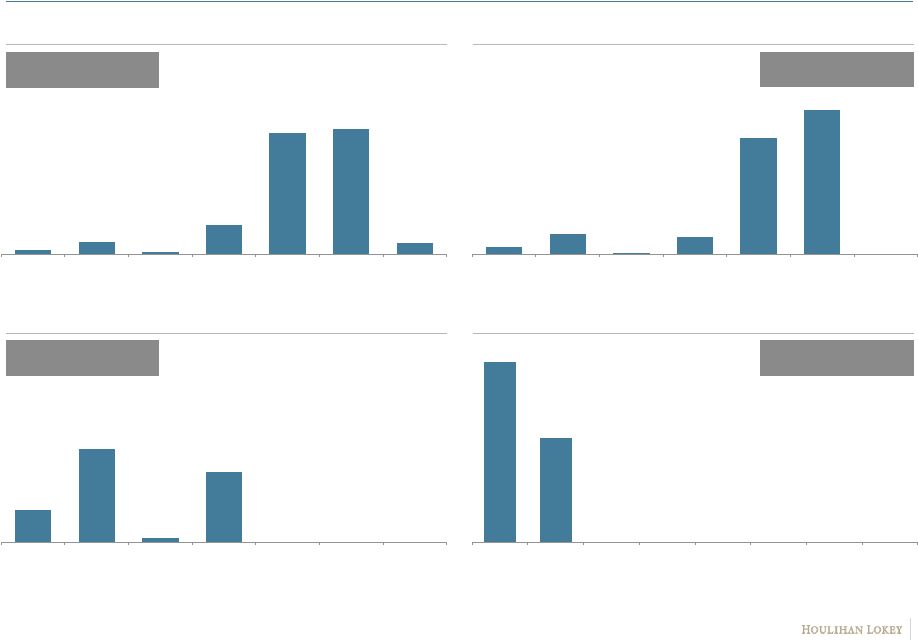 CONFIDENTIAL - PRELIMINARY DRAFT - SUBJECT TO FURTHER REVIEW Since Re-Listing Last Three Months Last Month Last Week Selected Historical Trading Activity Note: VWAP in dollars. 1. Based on VWAP over specified period (last week, last month, last three months or since re-listing).
Source: Bloomberg as of 8/20/19.
1.4% 4.1% 0.7% 9.5% 39.6% 41.0% 3.6% $10.00- $12.00 $12.00- $14.00 $14.00- $16.00 $16.00- $18.00 $18.00- $20.00 $20.00- $22.00 $22.00- $24.00 2.2% 6.5% 0.3% 5.7% 38.1% 47.2% 0.0% $10.00- $12.00 $12.00- $14.00 $14.00- $16.00 $16.00- $18.00 $18.00- $20.00 $20.00- $22.00 $22.00- $24.00 16.0% 46.8% 2.0% 35.2% 0.0% 0.0% 0.0% $10.00- $12.00 $12.00- $14.00 $14.00- $16.00 $16.00- $18.00 $18.00- $20.00 $20.00- $22.00 $22.00- $24.00 63.3% 36.7% 0.0% 0.0% 0.0% 0.0% 0.0% 0.0% $10.00- $12.00 $12.00- $14.00 $14.00- $16.00 $16.00- $18.00 $18.00- $20.00 $20.00- $22.00 $22.00- $24.00 $24.00- $26.00 Volume: 5.0 million VWAP¹: $19.26 Volume: 0.1 million VWAP¹: $12.31 Volume: 0.4 million VWAP¹: $14.40 Volume: 3.2 million VWAP¹: $19.03 10 |
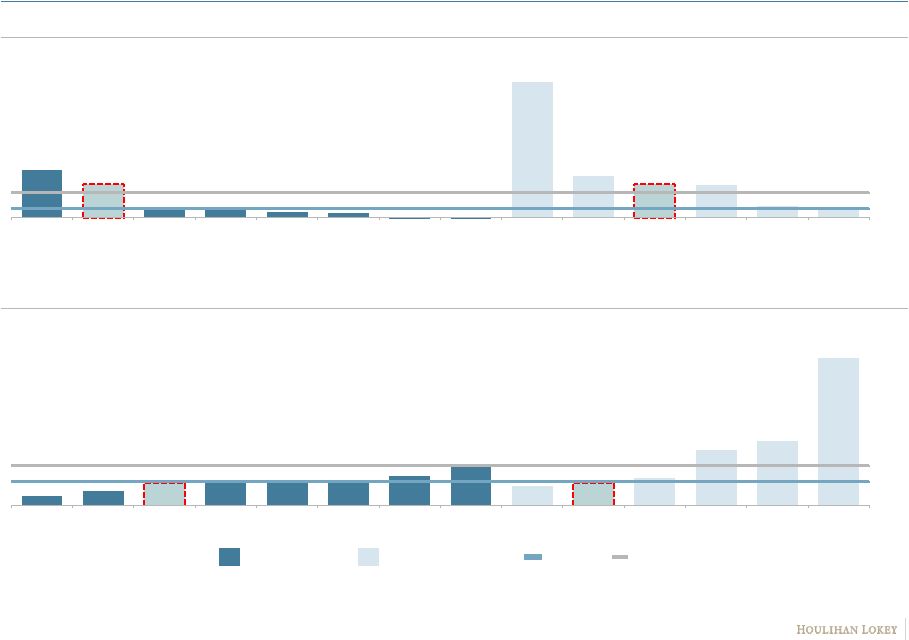
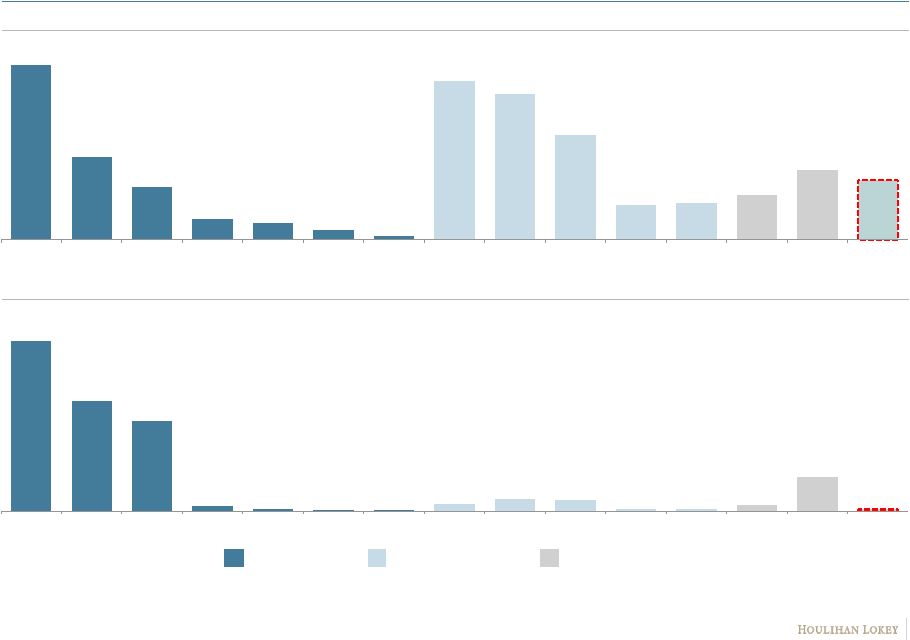 CONFIDENTIAL - PRELIMINARY DRAFT - SUBJECT TO FURTHER REVIEW Selected Float and Trading Data Average Daily Volume 1 / Public Float Average Daily Traded Value 2 (dollars in millions) Note: Refer to Glossary for full company names. 1. Based on 90-day average trading volume as of 8/20/19. 2. Based on 90-day average trading value as of 8/20/19. Sources: Capital IQ and public filings. Drilling Services Rental Tool Services Summary Statistics 4.5% 2.1% 1.4% 0.5% 0.4% 0.2% 0.1% 4.1% 3.7% 2.7% 0.9% 0.9% 1.2% 1.8% 1.5% NBR PTEN HP ICD PD ESI PHX BAS KEG SPN KLXE FI Median Mean Poconos $70.0 $45.2 $37.1 $2.2 $0.9 $0.4 $0.1 $3.1 $5.0 $4.5 $1.0 $0.7 $2.6 $14.2 $1.1 HP PTEN NBR PD ESI ICD PHX KLXE SPN FI BAS KEG Median Mean Poconos 11 |
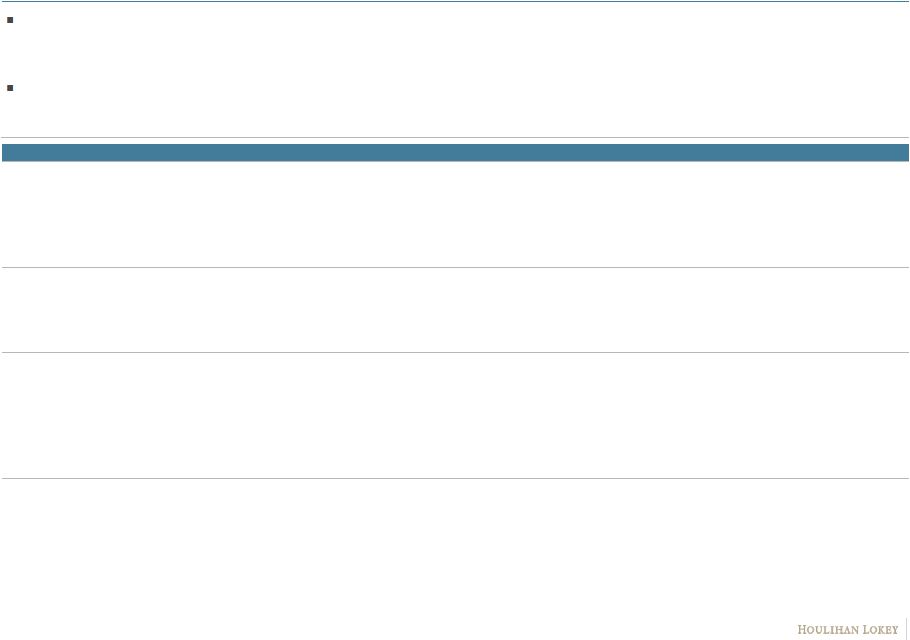 CONFIDENTIAL - PRELIMINARY DRAFT - SUBJECT TO FURTHER REVIEW Date of Report Recommendation Price Target Share Price¹ Comments August 7, 2019 Outperform $34.00 $12.37 July 19, 2019 Outperform $34.00 $19.37 May 23, 2019 Outperform $34.00 $19.34 May 9, 2019 Outperform $25.00 $21.88 Selected Equity Research Analyst Observations As of August 20, 2019, the Company is covered by a single designated equity research analyst, Imperial Capital’s Jason Wangler.
Imperial Capital currently has an Outperform rating and price target of
$34.00 per share on Poconos common stock, implying a premium of ~148.2%
versus the Company’s closing share price of $13.70 as of August 20, 2019. Previously and until commencing Chapter 11 restructuring in December 2018, the Company was also covered by Macquarie Research.
Selected Post-Restructuring Imperial Capital Equity Research Commentary
1. Reflects closing share price as of applicable report date.
Sources: Bloomberg and equity research research as of 8/20/19.
12 “We are maintaining our Outperform rating and one-year price
target of $34.00 on [Poconos] shares following Q2 CY 2019
results…The strong [reported] results allowed [the Company] to generate free
cash flow during the period given a relatively low capex level.” “The [C]ompany was able to generate higher-than-expected EBITDA as margins expanded sequentially alongside flattish revenue that outperformed more domestically-focused peers…The [C]ompany expects to see a significant reduction in revenues domestically, but due to offshore/ international
strength, was able to reiterate CY 2019E adjusted EBITDA guidance of $120-130
million.” “[The Company] emerged from restructuring at the end of Q1 CY 2019, so Q2 CY
2019E should be a cleaner quarter and given company guidance is
expected to generate significant growth for the [C]ompany.” “The [C]ompany was able to reduce its debt significantly through the restructuring and has ample cash on the books currently.” “[The Company] laid out Q2 CY 2019E and full-year guidance on its earnings conference call on 5/8/19 that
was ahead of our previous expectations. “The [C]ompany’s 13.0% cost of debt on the Second Lien term loan (11.0% cash and 2.0% PIK) is
significantly higher than peer companies with low debt levels, favorable metrics, and
growth opportunities in place.” “Our
one-year price target of $34 is based on the use of a 4.0x CY 2020E EV/adjusted EBITDA peer
group multiple that is consistent with peers and above the
sub-3.0x multiple where [the Company] currently trades.”
“Q1 CY 2019 results show higher-than-expected revenue and adjusted EBITDA as [the Company] focuses on growing its Rental Tools segment, higher rig utilizations, and generating free cash flow
in H2 CY 2019E.” “[The Company] ended Q1 CY 2019 with $128 million in cash and $210 million in debt that provides ample
liquidity for [the Company] to continue moving forward with its growth initiatives. Additionally, if [the Company] is able to achieve its free cash flow aspirations in H2 2019E, we believe it could refinance
the $210 million Second Lien Term Loan that carries a high interest rate of 11.0% cash
and 2.0% PIK that would lower [the Company]’s borrowing costs
significantly and drive incremental cash flows.” |
 1. Executive Summary 2. Public Market Information 3. Preliminary Financial Analyses 4. Appendices 5. Disclaimer |
 CONFIDENTIAL - PRELIMINARY DRAFT - SUBJECT TO FURTHER REVIEW Preliminary Financial Analyses Summary (dollars in millions) 14 Note: No particular weight was attributed to any analysis. 1. Includes restricted cash balance of ~$2.0 million as of 6/30/19 returned to unrestricted cash and cash equivalents in August 2019 due to lower
than expected payments for professional fees incurred in connection with
corporate restructuring, per Poconos management.
2. Shares and dilutive securities per Poconos management and public filings. Includes (i) 15.0 million shares outstanding as of 6/30/19 and (ii)
dilutive impact of 2.6 million warrants, to the extent in-the-money. Does not include dilutive impact of 0.4 million unvested options and 0.4 million unvested restricted stock units, per Poconos management.
Sources: Poconos historical financials and projections per Poconos management and public
filings. Selected Companies
Selected Companies Selected Companies Discounted Cash Analysis Analysis Analysis Flow Analysis LTM Ended 6/30/19 CY 2019E CY 2020E Terminal Multiple Adjusted EBITDA Adjusted EBITDA Adjusted EBITDA 2.25x -- 2.75x Discount Rate Corresponding Base Amount $111.0 $123.4 $176.7 12.5% -- 13.5% Selected Multiples Range 3.25x -- 4.25x 3.00x -- 4.00x 2.00x -- 2.75x Implied Enterprise Value Reference Range $360.8 -- $471.8 $370.1 -- $493.4 $353.4 -- $485.9 $440.8 -- $526.8 Cash and Cash Equivalents as of 6/30/19 [1] 141.1 -- 141.1 141.1 -- 141.1 141.1 -- 141.1 141.1 -- 141.1 Implied Total Enterprise Value Reference Range $501.9 -- $612.9 $511.2 -- $634.5 $494.5 -- $627.1 $582.0 -- $668.0 Total Debt as of 6/30/19 (211.1) -- (211.1) (211.1) -- (211.1) (211.1) -- (211.1) (211.1) -- (211.1) Implied Total Equity Value Reference Range $290.8 -- $401.8 $300.1 -- $423.4 $283.4 -- $415.9 $370.8 -- $456.8 Shares Outstanding [2] 15.0 -- 15.0 15.0 -- 15.0 15.0 -- 15.0 15.0 -- 15.0 Implied Per Share Value Reference Range $19.33 -- $26.71 $19.94 -- $28.14 $18.84 -- $27.65 $24.65 -- $30.36 |
  CONFIDENTIAL
- PRELIMINARY DRAFT -
SUBJECT TO FURTHER REVIEW
Calendar Year Ended December 31,
LTM Ended Calendar Year Ending December 31, CAGR 2016 2017 2018 6/30/2019 2019E 2020E 2021E 2018 to 2021E International & Alaska Drilling $287.3 $247.3 $213.4 $249.5 $272.4 $296.1 $336.9 U.S. (Lower 48) Drilling 5.4 12.4 11.7 26.2 44.7 39.8 48.9 International Rental Tools Services 62.6 60.9 79.2 85.0 95.4 107.0 114.7 U.S. Rental Tools Services 71.6 121.9 176.5 205.2 199.4 230.6 245.0 Total Revenue $427.0 $442.5 $480.8 $566.0 $611.8 $673.5 $745.6 15.7% Growth % 3.6% 8.7% 27.2% 10.1% 10.7% International & Alaska Drilling Operating Expenses (222.8) (206.6) (199.3) (227.2) (240.9) (234.7) (263.9) U.S. (Lower 48) Drilling Operating Expenses (19.7) (19.5) (19.7) (28.2) (40.6) (35.2) (39.6) International Rental Tools Services Operating Expenses (69.7) (66.6) (75.3) (78.6) (83.8) (89.6) (92.8) U.S. Rental Tools Services Operating Expenses (50.2) (62.8) (83.9) (94.4) (95.1) (106.5) (113.6) Total Operating Expenses (362.5) (355.5) (378.1) (428.5) (460.4) (466.0) (509.8) Total Gross Profit $64.5 $87.0 $102.7 $137.5 $151.5 $207.5 $235.8 31.9% Margin % 15.1% 19.7% 21.4% 24.3% 24.8% 30.8% 31.6% Corporate General & Administrative Expenses (34.3) (25.7) (24.5) (26.5) (28.1) (30.8) (32.0) Restructuring Charges [1] 0.0 0.0 (24.0) (63.9) (42.5) 0.0 0.0 Other One-Time Items [2] (1.6) (4.8) (52.4) (103.4) (51.1) 0.0 0.0 EBITDA $28.5 $56.6 $1.7 ($56.2) $29.7 $176.7 $203.8 392.1% Margin % 6.7% 12.8% 0.4% -9.9% 4.9% 26.2% 27.3% Growth % 98.2% -97.0% NMF NMF 15.3% Total Adjustments [3] 1.6 4.8 76.5 167.2 93.6 0.0 0.0 Adjusted EBITDA $30.2 $61.4 $78.2 $111.0 $123.4 $176.7 $203.8 37.6% Margin % 7.1% 13.9% 16.3% 19.6% 20.2% 26.2% 27.3% Growth % 103.5% 27.4% 57.8% 43.3% 15.3% Depreciation & Amortization (139.8) (122.4) (107.5) (97.4) (87.5) (90.0) (102.3) Adjusted EBIT ($109.6) ($61.0) ($29.4) $13.7 $35.8 $86.7 $101.5 NMF Margin % -25.7% -13.8% -6.1% 2.4% 5.9% 12.9% 13.6% Growth % -44.4% -51.9% NMF 142.1% 17.1% Additional Financial Information Capital Expenditures $29.0 $54.5 $70.6 $72.3 $91.8 $104.3 $109.5 Net Working Capital [4] $63.7 $72.6 $113.5 $81.0 $87.4 $125.4 $148.1 Change in Net Working Capital ($8.9) ($40.9) $26.1 ($38.1) ($22.7) Selected Historical and Projected Financial Data (dollars in millions) 1. Includes professional fees, backstop premium, fresh-start adjustments and other items associated with Poconos' restructuring, per Poconos management. Does not include separately disclosed reorganization items. 2. Reflects total adjustments other than restructuring charges separately disclosed above.
3. CY 2019 adjustments assume no additional adjustments incurred during remainder of CY. Total Adjustments:
4. Excludes restricted cash from computations, as applicable. 5. Consists of (i) gain on settlement of liabilities subject to compromise and (ii) fresh start revaluation gain, per Poconos
management. Source: Poconos historical financials and projections per
Poconos management. Asset Impairment
($0.0) $1.9 $50.7 $50.7 $0.0 $0.0 $0.0 Loss (Gain) on Disposition of Assets 1.6 2.9 1.7 1.3 (0.3) 0.0 0.0 Restructuring Charges [1] 0.0 0.0 24.0 63.9 42.5 0.0 0.0 Reorganization Items [5] 0.0 0.0 0.0 51.4 51.4 0.0 0.0 Total Adjustments $1.6 $4.8 $76.5 $167.2 $93.6 $0.0 $0.0 15 |
 CONFIDENTIAL - PRELIMINARY DRAFT - SUBJECT TO FURTHER REVIEW Selected Companies Analysis (dollars in millions, except per share values) Note: No company used in this analysis for comparative purposes is identical to Poconos.
1. Enterprise Value equals equity market value + debt outstanding + preferred stock + minority interests – cash and cash equivalents. 2. Based on closing prices as of 8/20/19. 3. Based on diluted shares. 4. Multiples based on forward looking financial information may have been calendarized to Poconos’ fiscal year end of December
31st. 5. Enterprise Value adjusted for market value of debt as of 8/20/19. Untraded debt or debt for which pricing information was unavailable not
adjusted. 6.
Based on publicly available information, analyst estimates and market data as of
8/20/19. Sources: Bloomberg, Capital IQ and public filings.
Share Equity Market Enterprise Enterprise Value [1] to Adjusted EBITDA Price [2] Value [2,3] Value [2,3] LTM CY 2019E [4] CY 2020E [4] Drilling Services Ensign Energy Services Inc. $2.21 $356.1 $1,578.1 5.4x 4.9x 4.6x Helmerich & Payne, Inc. $38.96 4,311.7 4,422.8 5.6x 5.5x 5.6x Independence Contract Drilling, Inc. $1.10 84.6 204.6 3.7x 3.6x 2.2x Nabors Industries Ltd. [5] $2.05 758.9 3,954.9 5.0x 4.8x 4.3x Patterson-UTI Energy, Inc. $8.38 1,727.5 2,591.6 3.4x 4.0x 4.1x PHX Energy Services Corp. $1.92 116.8 128.4 4.1x 3.8x 3.4x Precision Drilling Corporation [5] $1.21 375.6 1,396.0 4.7x 4.7x 4.4x Low 3.4x 3.6x 2.2x High 5.6x 5.5x 5.6x Median 4.7x 4.7x 4.3x Mean 4.5x 4.5x 4.1x Well Services Basic Energy Services, Inc. [5] $1.51 $40.8 $253.7 5.8x 4.8x 3.4x Frank's International N.V. $4.58 1,044.8 874.8 NMF 14.1x 9.2x Key Energy Services, Inc. $1.30 27.5 239.9 NMF NMF 9.4x KLX Energy Services Holdings, Inc. $11.68 299.2 430.9 3.7x 2.8x 2.5x Superior Energy Services, Inc. [5] $0.47 75.5 696.6 2.2x 2.7x 2.4x Low 2.2x 2.7x 2.4x High 5.8x 14.1x 9.4x Median 3.7x 3.8x 3.4x Mean 3.9x 6.1x 5.4x All Selected Companies Low 2.2x 2.7x 2.2x High 5.8x 14.1x 9.4x Median 4.4x 4.7x 4.2x Mean 4.3x 5.1x 4.6x Poconos [6] $13.70 $206.1 $276.1 2.5x ## 2.3x ## 2.1x 16 |
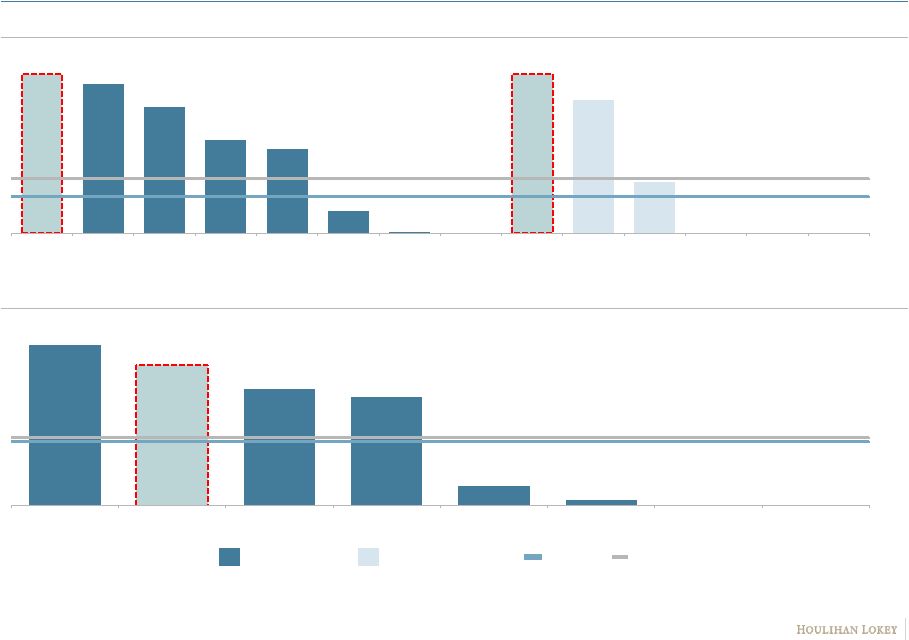
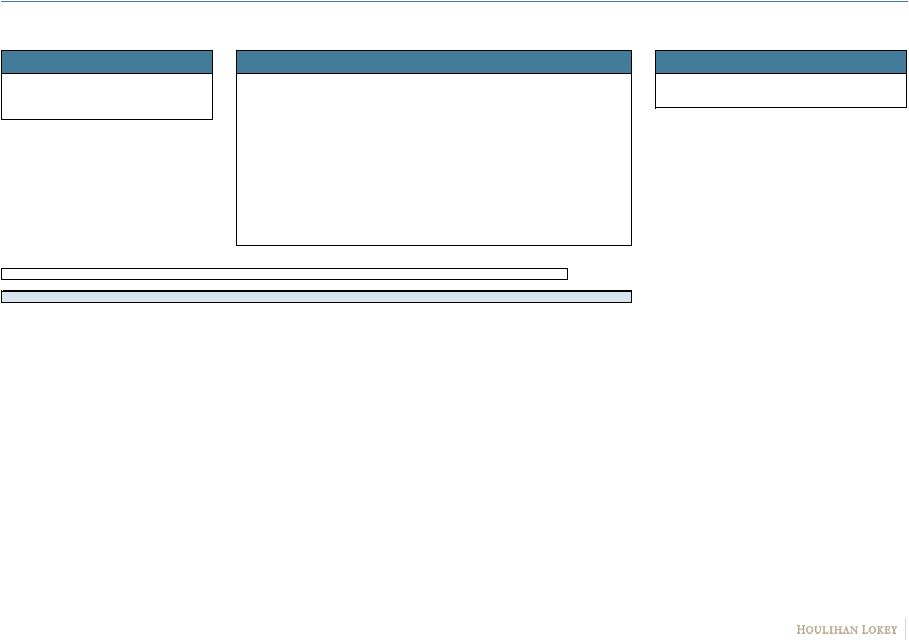
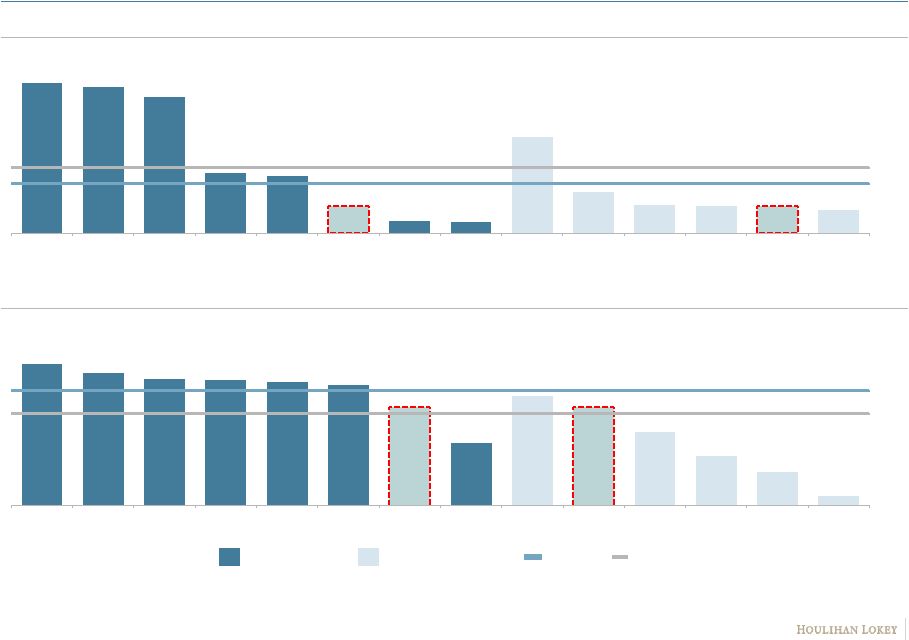 CONFIDENTIAL - PRELIMINARY DRAFT - SUBJECT TO FURTHER REVIEW Selected Benchmarking Data LTM Total Revenue CY 2019E Adjusted EBITDA to CY 2019E Revenue Note: No company shown for comparative purposes is identical to Poconos. Refer to Glossary for full company names.
Sources: Capital IQ, Bloomberg, public filings, press releases and Poconos historical
financials and projections per Poconos management. $3,132.6
$3,043.4 $2,846.3 $1,264.8 $1,203.0 $566.0 $264.5 $235.2 $2,015.9 $863.7 $585.6 $574.9 $566.0 $474.2 0 0 0 0 0 0 0 0 0 0 0 0 0 0 NBR PTEN HP ESI PD Poconos PHX ICD SPN BAS KLXE FI Poconos KEG (dollars in millions) $1,375.3 $1,033.4 28.7% 27.0% 25.8% 25.6% 25.1% 24.6% 20.2% 12.7% 22.4% 20.2% 15.1% 10.1% 6.9% 2.0% 0 0 0 0 0 0 0 0 0 0 0 0 0 0 HP ICD NBR ESI PTEN PD Poconos PHX KLXE Poconos SPN FI BAS KEG 18.8% 23.5% Rental Tool Services Drilling Services Median Mean 17 |
 CONFIDENTIAL - PRELIMINARY DRAFT - SUBJECT TO FURTHER REVIEW 28.9% 43.6% 65.2% 65.6% 68.7% 71.3% 85.4% 114.4% 56.0% 65.2% 79.7% 162.1% 186.4% 430.4% 0 0 0 0 0 0 0 0 0 0 0 0 0 0 ESI PD Poconos NBR HP PTEN ICD PHX SPN Poconos KLXE BAS FI KEG 61.4% 43.3% 12.1% 11.3% 6.8% 6.6% -0.9% -2.0% 174.7% 53.4% 43.3% 42.8% 15.1% 11.3% 0 0 0 0 0 0 0 0 0 0 0 0 0 0 ICD Poconos PHX NBR ESI PD HP PTEN KEG FI Poconos BAS KLXE SPN Selected Benchmarking Data (cont.)
Note: No company shown for comparative purposes is identical to Poconos. Refer to
Glossary for full company names. Sources: Capital IQ, Bloomberg, public
filings, press releases and Poconos historical financials and projections per Poconos management. CY 2019E to CY 2020E Adjusted EBITDA Growth LTM Capital Expenditures to LTM Adjusted EBITDA 32.7% 11.7% 116.0% 70.0% Rental Tool Services Drilling Services Median Mean 18 |
 CONFIDENTIAL - PRELIMINARY DRAFT - SUBJECT TO FURTHER REVIEW 74.7% 65.5% 54.4% 50.4% 9.2% 2.4% 0.0% NA 0 0 0 0 0 0 0 0 PD [1] Poconos [2] ESI NBR [2] HP PTEN [1] ICD PHX 55.9% 52.4% 44.5% 32.9% 29.5% 7.9% 0.3% 0.0% 55.9% 46.8% 17.9% 0.0% 0.0% 0.0% 0 0 0 0 0 0 0 0 0 0 0 0 0 0 Poconos NBR PD ESI PHX HP PTEN [1] ICD Poconos FI SPN BAS KEG KLXE Selected Benchmarking Data (cont.)
Note: No company shown for comparative purposes is identical to Poconos. Refer to
Glossary for full company names. 1. Displayed information is as of
12/31/18, which reflects the latest available detail. 2. International rig
count includes rigs deployed in Alaska, per public filings. Sources:
Capital IQ, Bloomberg, public filings, press releases and Poconos historical financials per Poconos management. LTM International Revenue to LTM Total Revenue International Drilling Rig Count to Total Rig Count 19.4% 12.9% 31.8% 29.8% Rental Tool Services Drilling Services Median Mean 19 |
 CONFIDENTIAL - PRELIMINARY DRAFT - SUBJECT TO FURTHER REVIEW Discounted Cash Flow Analysis (dollars in millions) Note: Present values as of 9/15/19; mid-year convention applied. Refer to WACC calculation for derivation of discount rate.
1. Represents 3.5 months of projected quarterly financial information. 2. Projected taxes per Poconos management. Terminal year tax rate at 22.5%, per Poconos management.
3. Reflects portion of other minor operating cash flow items not attributable to change in net working capital, per Poconos management.
4. Implied from corresponding discount rate and 2021E Adjusted EBITDA multiple. Source: Poconos projections per Poconos management. Projected Calendar Year Ending December 31, Terminal Value 2019E [1] 2020E 2021E Assumptions Total Revenue $172.2 $673.5 $745.6 $745.6 Growth % 15.0% 10.1% 10.7% Total Operating Expenses (130.4) (466.0) (509.8) (509.8) Corporate General & Administrative Expenses (8.2) (30.8) (32.0) (32.0) Adjusted EBITDA $33.6 $176.7 $203.8 $203.8 Margin % 19.5% 26.2% 27.3% 27.3% Depreciation & Amortization (24.4) (90.0) (102.3) (109.5) Adjusted EBIT $9.2 $86.7 $101.5 $94.3 Taxes [2] (4.2) (9.8) (11.9) (21.2) Unlevered Earning $4.9 $77.0 $89.6 $73.1 Discount Rate 2.25x 2.50x 2.75x Depreciation & Amortization 24.4 90.0 102.3 109.5 12.50% -3.2% -1.8% -0.7% Capital Expenditure (29.3) (104.3) (109.5) (109.5) 12.75% -3.0% -1.6% -0.5% Change in Net Working Capital (6.3) (38.1) (22.7) (2.9) 13.00% -2.8% -1.4% -0.3% Other Cash Flow Items [3] 11.0 15.9 11.1 0.0 13.25% -2.6% -1.2% -0.1% Unlevered Free Cash Flows $4.9 $40.5 $70.9 $70.2 13.50% -2.4% -1.0% 0.1% Present Value PV of Terminal Value of Cash Flows as a Multiple of Implied Enterprise Value (2019 - 2021) 2021 Adjusted EBITDA Discount Rate 2.25x 2.50x 2.75x 2.25x 2.50x 2.75x Discount Rate 2.25x 2.50x 2.75x 12.50% $99.0 $350.0 $388.9 $427.8 $449.0 $487.9 $526.8 12.50% 78.0% 79.7% 81.2% 12.75% $98.7 $348.3 $387.0 $425.7 $447.0 $485.7 $524.4 12.75% 77.9% 79.7% 81.2% 13.00% $98.4 + $346.5 $385.0 $423.5 = $444.9 $483.4 $521.9 13.00% 77.9% 79.6% 81.1% 13.25% $98.1 $344.7 $383.0 $421.4 $442.9 $481.2 $519.5 13.25% 77.8% 79.6% 81.1% 13.50% $97.8 $343.0 $381.1 $419.2 $440.8 $479.0 $517.1 13.50% 77.8% 79.6% 81.1% PV of Terminal Value as a % of Enterprise Value Implied Perpetual Growth Rate [4] 20 |
 1. Executive Summary 2. Public Market Information 3. Preliminary Financial Analyses 4. Appendices Weighted Average Cost of Capital Calculation Illustrative Summary of Selected Implied Premiums Paid Observations Glossary of Selected Terms 5. Disclaimer |
 1. Executive Summary 2. Public Market Information 3. Preliminary Financial Analyses 4. Appendices Weighted Average Cost of Capital Calculation Illustrative Summary of Selected Implied Premiums Paid Observations Glossary of Selected Terms 5. Disclaimer |
 CONFIDENTIAL - PRELIMINARY DRAFT - SUBJECT TO FURTHER REVIEW Weighted Average Cost of Capital Calculations Note: No company used in this calculation for comparative purposes is identical to Poconos.
1. Total Cap refers to total capitalization, which equals Equity Market Value + Total Debt + Pfd. Stock.
2. Total Debt refers to total debt amount based on most recent public filings as of 8/20/19.
3. Dd refers to Implied Tax-Deductible Debt, which equals the lesser of (a) 30% of Adjusted Taxable Income/Cost of Debt, or (b) Total Debt. LTM
Adjusted EBITDA, based on most recent public filings as of 8/20/19, is
assumed to be a valid proxy for Adjusted Taxable Income for the selected
companies. 4.
Dnd refers to Implied Non-Tax-Deductible Debt, which equals Total Debt minus
Dd. 5. Equity Market Value based on closing price on 8/20/19 and on diluted shares as of 8/20/19.
6. Pfd. Stock refers to preferred stock, which is the amount as stated in most recent public filings as of 8/20/19.
7. Enterprise Value adjusted for market value of debt as of 8/20/19. Untraded debt or debt for which pricing information was unavailable not
adjusted. 8.
Based on publicly available information and market data as of 8/20/19.
Sources: Bloomberg and Capital IQ.
23 Total Debt to Dd to Dnd to Total Debt to Dd to Equity Dnd to Equity Pfd. Stock to Equity Market Pfd. Stock to Total Cap Total Cap Total Cap Equity Market Market Value Market Value Total Cap Value to Total Equity Market [1][2] [1][3] [1][4] Value [2][5] [3][5] [4][5] [1][6] Cap [1][5] Value [5][6] Drilling Services Ensign Energy Services Inc. 77.8% # 72.3% # 5.5% # 350.4% # 325.8% # 24.5% # 0.0% # 22.2% # 0.0% Helmerich & Payne, Inc. 10.2% # 10.2% # 0.0% # 11.4% # 11.4% # 0.0% # 0.0% # 89.8% # 0.0% Independence Contract Drilling, Inc. 60.6% # 60.6% # 0.0% # 153.9% # 153.9% # 0.0% # 0.0% # 39.4% # 0.0% Nabors Industries Ltd. [7] 80.4% # 80.4% # 0.0% # 408.9% # 408.9% # 0.0% # 0.0% # 19.6% # 0.0% Patterson-UTI Energy, Inc. 39.3% # 39.3% # 0.0% # 64.8% # 64.8% # 0.0% # 0.0% # 60.7% # 0.0% PHX Energy Services Corp. 12.8% # 12.8% # 0.0% # 14.7% # 14.7% # 0.0% # 0.0% # 87.2% # 0.0% Precision Drilling Corporation [7] 74.2% # 74.2% # 0.0% # 287.8% # 287.8% # 0.0% # 0.0% # 25.8% # 0.0% 25th Percentile 26.1% 26.1% 0.0% 39.8% 39.8% 0.0% 0.0% 24.0% 0.0% Median 60.6% 60.6% 0.0% 153.9% 153.9% 0.0% 0.0% 39.4% 0.0% Mean 50.8% 50.0% 0.8% 184.6% 181.0% 3.5% 0.0% 49.2% 0.0% 75th Percentile 76.0% 73.3% 0.0% 319.1% 306.8% 0.0% 0.0% 73.9% 0.0% Well Services Basic Energy Services, Inc. [7] 86.7% # 40.9% # 45.8% # 653.2% # 307.9% # 345.3% # 0.0% # 13.3% # 0.0% Frank's International N.V. 0.2% # 0.2% # 0.0% # 0.2% # 0.2% # 0.0% # 0.0% # 99.8% # 0.0% Key Energy Services, Inc. 89.8% # 7.8% # 82.0% # 879.5% # 76.8% # 802.7% # 0.0% # 10.2% # 0.0% KLX Energy Services Holdings, Inc. 44.7% # 44.7% # 0.0% # 81.0% # 81.0% # 0.0% # 0.0% # 55.3% # 0.0% Superior Energy Services, Inc. [7] 91.9% # 91.9% # 0.0% # 1132.6%#
1132.6% # 0.0% # 0.0% # 8.1% # 0.0% 25th Percentile 44.7% 7.8% 0.0% 81.0% 76.8% 0.0% 0.0% 10.2% 0.0% Median 86.7% 40.9% 0.0% 653.2% 81.0% 0.0% 0.0% 13.3% 0.0% Mean 62.7% 37.1% 25.6% 549.3% 319.7% 229.6% 0.0% 37.3% 0.0% 75th Percentile 89.8% 44.7% 45.8% 879.5% 307.9% 345.3% 0.0% 55.3% 0.0% All Selected Companies 25th Percentile 32.7% 12.2% 0.0% 52.3% 52.3% 0.0% 0.0% 18.1% 0.0% Median 67.4% 42.8% 0.0% 220.8% 117.4% 0.0% 0.0% 32.6% 0.0% Mean 55.7% 44.6% 11.1% 336.5% 238.8% 97.7% 0.0% 44.3% 0.0% 75th Percentile 81.9% 72.8% 1.4% 470.0% 312.4% 6.1% 0.0% 67.3% 0.0% Poconos [8] 50.6% 50.6% 0.0% 102.4% 102.4% 0.0% 0.0% 49.4% 0.0% |
 CONFIDENTIAL - PRELIMINARY DRAFT - SUBJECT TO FURTHER REVIEW Weighted Average Cost of Capital Calculations (cont.) Note: No company used in this calculation for comparative purposes is identical to Poconos.
1. Based on actual levered beta per Bloomberg 5-year weekly as of 8/20/19. 2. Unlevered Beta = Levered Beta/(1 + ((1 – tax rate) * Dd to Equity Market Value) + (Dnd to Equity Market Value) + (Pfd. Stock to Equity Market Value)). 3. Based on review of studies measuring the historical returns between stocks and bonds, theoretical models such as supply-side and
demand-side models and other materials. 4.
Duff & Phelps Cost of Capital Navigator ("Navigator").
5. Cost of Equity = Risk-Free Rate of Return + (Levered Beta * Equity Risk Premium) + Size Premium. Risk-Free Rate of Return as of
8/20/19, based on 20-year U.S. Treasury Bond Yield. 6.
Based on selected company weighted average interest rate per most recent public filings
as of 8/20/19. 7.
Based on selected company weighted average preferred dividend per most recent public
filings 8/20/19. 8.
Enterprise Value adjusted for market value of debt as of 8/20/19. Untraded debt or debt
for which pricing information was unavailable not adjusted. 9.
Based on publicly available information and market data as of 8/20/19.
* Excluded from low, high, median and mean data.
Sources: Bloomberg and Capital IQ.
24 Debt Levered Unlevered Equity Risk Size Cost of Cost of Cost of Pfd. Beta [5] Beta [1] Beta [2] Premium [3] Premium [4] Equity [5] Debt [6] Stock [7] WACC Drilling Services Ensign Energy Services Inc. Input 1.55 # 0.41 # 6.00% 2.46% 13.6% # 7.6% # NA NA 7.7% Helmerich & Payne, Inc. Input 1.40 # 1.29 # 6.00% 1.28% 11.5% # 4.7% # NA NA 10.7% Independence Contract Drilling, Inc. Input 1.52 # 0.69 # 6.00% 5.22% 16.2% # 9.6% # NA NA 10.9% Nabors Industries Ltd. [8] Input 1.96 # 0.47 # 6.00% 1.80% 15.4% # 4.5% # 6.0% # 5.8% Patterson-UTI Energy, Inc. Input 1.65 # 1.10 # 6.00% 1.58% 13.3% # 4.3% # NA NA 9.4% PHX Energy Services Corp. Input 2.53 # 2.27 # 6.00% 5.22% 22.2% # NA NA NA NA NA Precision Drilling Corporation [8] Input 2.69 # 0.85 # 6.00% 2.46% 20.4% # 6.7% # NA NA 9.1% 25th Percentile 1.53 0.58 13.5% 4.5% 6.0% 8.1% Median 1.65 0.85 15.4% 5.7% 6.0% 9.3% Mean 1.90 1.01 16.1% 6.2% 6.0% 8.9% 75th Percentile 2.25 1.20 18.3% 7.4% 6.0% 10.4% Well Services Basic Energy Services, Inc. [8] Input 2.14 # 0.31 * 6.00% 5.22% 19.9% # 10.4% # NA NA 10.7% Frank's International N.V. Input 1.47 # 1.47 * 6.00% 1.80% 12.5% # 3.9% # NA NA 12.5% Key Energy Services, Inc. Input 2.76 # 0.29 * 6.00% 5.22% 23.6% # 12.4% # NA NA 13.3% KLX Energy Services Holdings, Inc. Input 0.83 # 0.51 * 6.00% 5.22% 12.0% # 11.5% # NA NA 10.6% Superior Energy Services, Inc. [8] Input 2.28 # 0.23 * 6.00% 5.22% 20.8% # 7.4% # NA NA 6.9% 25th Percentile 1.47 NA 12.5% 7.4% NA 10.6% Median 2.14 NA 19.9% 10.4% NA 10.7% Mean 1.90 NA 17.8% 9.1% NA 10.8% 75th Percentile 2.28 NA 20.8% 11.5% NA 12.5% All Selected Companies 25th Percentile 1.51 0.58 13.1% 4.6% 6.0% 8.4% Median 1.81 0.85 15.8% 7.4% 6.0% 10.6% Mean 1.90 1.01 16.8% 7.5% 6.0% 9.8% 75th Percentile 2.34 1.20 20.5% 10.0% 6.0% 10.8% Poconos [9] NMF NMF 6.00% 5.22% NMF 13.0% NA NMF |
 CONFIDENTIAL - PRELIMINARY DRAFT - SUBJECT TO FURTHER REVIEW Weighted Average Cost of Capital Calculations (cont.)
(dollars in millions) 1. Risk-Free Rate of Return as of 8/20/19, based on 20-year U.S. Treasury Bond Yield.
2. Based on a review of studies measuring the historical returns between stocks and bonds, theoretical models such as supply side and demand side
models and other materials. 3.
Navigator. 4. Forward tax rate, per Poconos management. 5. Poconos LTM Adjusted EBITDA is assumed to be a valid proxy for Poconos Adjusted Taxable Income.
6. Poconos Total Debt refers to total debt amount of Poconos as of 8/20/19. 7. Poconos Dd refers to Implied Tax-Deductible Debt of Poconos, which equals the lesser of (a) 30% of Poconos Adjusted Taxable Income/Cost of
Debt, or (b) Poconos Total Debt. Based on Capital Structure
Assumptions. 8. Poconos Dnd refers to Implied Non-Tax-Deductible Debt of Poconos, which equals Poconos Total Debt minus Poconos Dd.
9. Based on capital structure resulting from Poconos' (i) actual Total Debt as of 8/20/19 and (ii) average of implied total equity value midpoints
resulting from Selected Companies Analysis valuation approaches. No
preferred stock outstanding.
10. Based on Poconos' Dd and Dnd and the Capital Structure Assumptions regarding Total Debt to Total Capitalization and Equity Market Value to Total
Capitalization. 11.
Based on Poconos' actual cost of debt and cost of preferred stock as of
8/20/19. 12.
Based on review and selection of 75th percentile of selected companies’ unlevered
betas listed on Weighted Average Cost of Capital Calculation (cont.) page.
13. Computed Levered Beta = Selected Unlevered Beta * (1 + ((1 – Tax Rate) * Dd to Equity Market Value) + (Dnd to Equity Market Value) + (Preferred Stock to Equity Market Value)). Based on Market and Capital Structure Assumptions. 14. Cost of Equity = Risk-Free Rate of Return + (Computed Levered Beta * Equity Risk Premium) + Size Premium. Based on Market
Assumptions. Sources: Bloomberg, Capital IQ and Poconos management.
Market Capital Structure Cost of Equity for Assumptions Assumptions Computed WACC Risk-Free Rate of Return [1] 1.84% Poconos Adjusted Taxable Income [5] $111.0 Selected Unlevered Beta [12] 1.20 Equity Risk Premium [2] 6.00% Poconos Total Debt [6] $211.1 Computed Levered Beta [13] 1.75 Size Premium [3] 2.46% Poconos Dd [7] $211.1 Cost of Equity [14] 14.8% Tax Rate [4] 22.50% Poconos Dnd [8] $0.0 Debt Beta [15] Total Debt to Total Capitalization [9] 37.5% Dd to Total Capitalization [10] 37.5% Dnd to Total Capitalization [10] 0.0% Total Debt to Equity Market Value 59.9% Dd to Equity Market Value [10] 59.9% Dnd to Equity Market Value [10] 0.0% Preferred Stock to Total Capitalization [9] 0.0% Equity Market Value to Total Capitalization [9] 62.5% Preferred Stock to Equity Market Value 0.0% Cost of Debt [11] 13.0% Cost of Preferred Stock [11] NA Computed Weighted Average Cost of Capital 13.0% Selected Weighted Average Cost of Capital Range 12.5% -- 13.5% 25 |
 1. Executive Summary 2. Public Market Information 3. Preliminary Financial Analyses 4. Appendices Weighted Average Cost of Capital Calculation Illustrative Summary of Selected Implied Premiums Paid Observations Glossary of Selected Terms 5. Disclaimer |
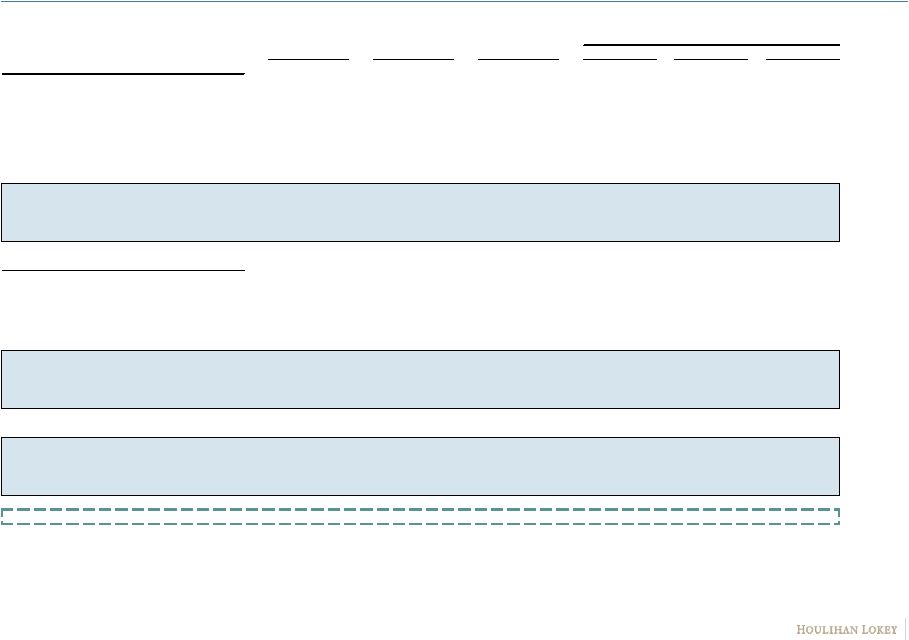
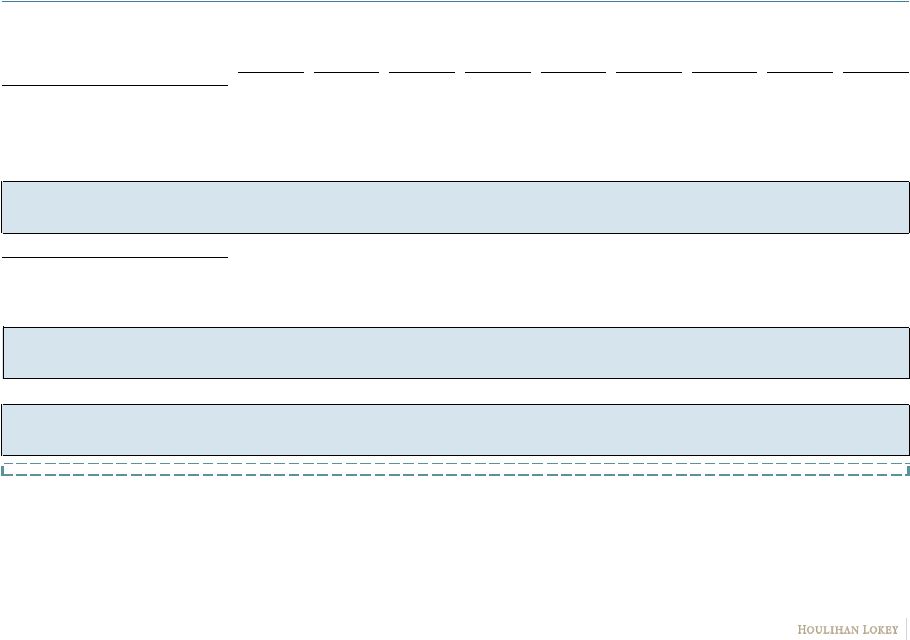
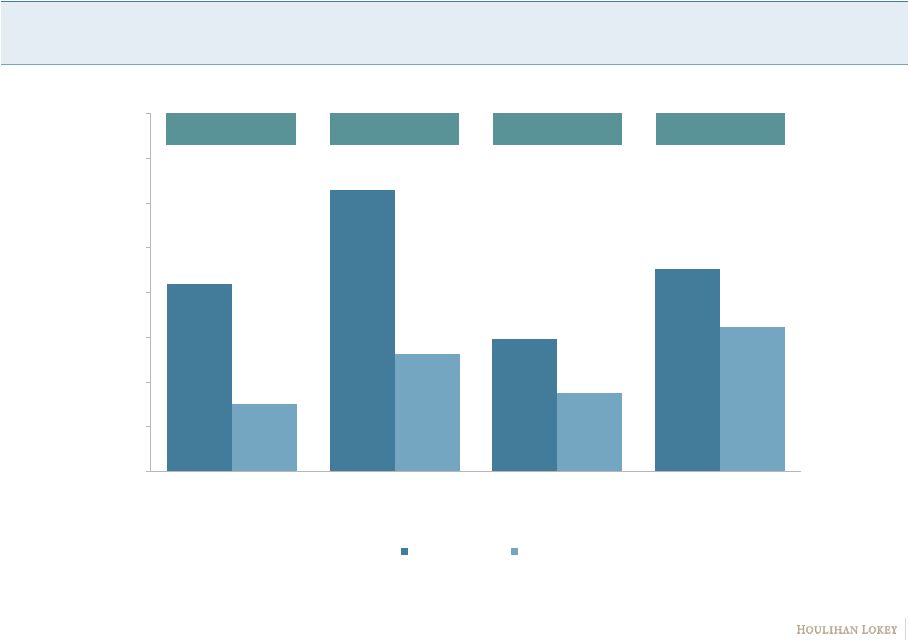 CONFIDENTIAL - PRELIMINARY DRAFT - SUBJECT TO FURTHER REVIEW Summary of Selected Implied Premiums Paid Observations 1. Based on twelve-month lookback of applicable unaffected implied premiums, per Mergerstat Q1 2019 Control Premium Study. 2. Based on one-day implied premiums, per Capital IQ and public filings. Sources: Mergerstat, Capital IQ and public filings. 42.0% 62.9% 29.7% 45.3% 15.2% 26.2% 17.7% 32.2% 0.0% 10.0% 20.0% 30.0% 40.0% 50.0% 60.0% 70.0% 80.0% Oil and Gas Extraction Transactions [1] All Domestic and International Transactions [1] Selected Transactions [2] Selected Public OFS Transactions [2] Mean Median Based on reviewed transactions, median implied premiums paid range from 15.2% to 32.2% depending on transaction characteristics
while mean implied premiums among review transactions are somewhat higher, ranging from
29.7% to 62.9% High: 287.1%
High: 6,900.0% High: 89.8% High: 287.1% 27 |
 1. Executive Summary 2. Public Market Information 3. Preliminary Financial Analyses 4. Appendices Weighted Average Cost of Capital Calculation Illustrative Summary of Selected Implied Premiums Paid Observations Glossary of Selected Terms 5. Disclaimer |
 CONFIDENTIAL - PRELIMINARY DRAFT - SUBJECT TO FURTHER REVIEW Glossary of Selected Terms Definition Description Adjusted EBITDA Adjusted EBITDA refers to Earnings Before Interest, Taxes, Depreciation and Amortization, adjusted for certain non-
recurring items Adjusted EBIT Adjusted EBIT refers to Earnings Before Interest and Taxes, adjusted for certain non-recurring items
BAS Basic Energy Services, Inc. CAGR Compound Annual Growth Rate CapEx Capital Expenditures CY Calendar Year E Estimated EBITDA Earnings Before Interest, Taxes, Depreciation and Amortization ESI Ensign Energy Services Inc. EV Enterprise Value FI Frank's International N.V. HP Helmerich & Payne, Inc. ICD Independence Contract Drilling, Inc. KEG Key Energy Services, Inc. KLXE KLX Energy Services Holdings, Inc. LTM The most recently completed 12-month period for which financial information has been made public, other than for
Poconos, in which case LTM refers to Latest 12 Months
NA Not available 29 |
 CONFIDENTIAL - PRELIMINARY DRAFT - SUBJECT TO FURTHER REVIEW Glossary of Selected Terms (cont.)
Definition Description NBR Nabors Industries Ltd. NMF Not meaningful figure PD Precision Drilling Corporation PHX PHX Energy Services Corp. PTEN Patterson-UTI Energy, Inc. PV Present Value SPN Superior Energy Services, Inc. VWAP Volume-Weighted Average Price WACC Weighted Average Cost of Capital 30 |
 1. Executive Summary 2. Public Market Information 3. Preliminary Financial Analyses 4. Appendices 5. Disclaimer |
 CONFIDENTIAL - PRELIMINARY DRAFT - SUBJECT TO FURTHER REVIEW Disclaimer 32 This presentation, and any supplemental information (written or oral) or other documents provided in connection therewith (collectively, the
“materials”), are provided solely for the information of the
Finance and Strategic Planning Committee (the “Committee”) of the Board of Directors (the “Board”) of Poconos (the “Company”) by Houlihan Lokey in connection with the Committee’s consideration of a series of potential transactions (the “Stock Splits”) involving the Company.
This presentation is incomplete without reference to, and should be
considered in conjunction with, any supplemental information provided by and discussions with Houlihan Lokey in connection therewith. Any defined terms used herein shall have the meanings set forth herein, even if such defined terms have been given different meanings elsewhere in the materials. The materials are for discussion purposes only. Houlihan Lokey expressly disclaims any and all liability, whether direct or indirect, in contract
or tort or otherwise, to any person in connection with the materials. The
materials were prepared for specific persons familiar with the business and affairs of the Company for use in a specific context and were not prepared with a view to public disclosure or to conform with any disclosure standards under any state, federal or international securities laws
or other laws, rules or regulations, and none of the Committee, the
Company or Houlihan Lokey takes any responsibility for the use of the materials by persons other than the Committee. The materials are provided on a confidential basis solely for the information of the Committee and may not be disclosed, summarized, reproduced, disseminated or
quoted or otherwise referred to, in whole or in part, without
Houlihan Lokey’s express prior written consent. Notwithstanding any other provision herein, the Company (and each employee, representative or other agent of the Company) may disclose to any and
all persons without limitation of any kind, the tax treatment and tax
structure of any transaction and all materials of any kind (including opinions or other tax analyses, if any) that are provided to the Company relating to such tax treatment and structure. However, any information relating to the tax treatment and tax structure shall remain
confidential (and the foregoing sentence shall not apply) to the extent
necessary to enable any person to comply with securities laws. For this purpose, the tax treatment of a transaction is the purported or claimed U.S. income or franchise tax treatment of the transaction and the tax structure of a transaction is any fact that may be relevant to
understanding the purported or claimed U.S. income or franchise tax
treatment of the transaction. If the Company plans to disclose information pursuant to the first sentence of this paragraph, the Company shall inform those to whom it discloses any such information that they may not rely upon such information for any purpose without Houlihan Lokey’s prior
written consent. Houlihan Lokey is not an expert on, and nothing contained
in the materials should be construed as advice with regard to, legal, accounting, regulatory, insurance, tax or other specialist matters. Houliha Lokey’s role in reviewing any information was limited solely to performing such a review as it deemed necessary to support its own advice
and analysis and was not on behalf of the Committee. The materials necessarily are based on financial, economic, market and other conditions as in effect on, and the information available to
Houlihan Lokey as of, the date of the materials. Although subsequent
developments may affect the contents of the materials, Houlihan Lokey has not undertaken, and is under no obligation, to update, revise or reaffirm the materials. The materials are not intended to provide the sole basis for evaluation of the Stock Splits and do not purport to contain
all information that may be required. The materials do not address the
underlying business decision of the Company, the Board, the Committee or any other party to proceed with or effect the Stock Splits, or the relative merits of the Stock Splits as compared to any alternative business strategies or transactions that might be available for the Company or
any other party. The materials do not constitute any opinion, nor do the
materials constitute a recommendation to the Committee, the Board, the Company, any security holder of the Company or any other party as to how to vote or act with respect to any matter relating to the Stock Splits or otherwise or whether to buy or sell any assets or securities of
any company. Houlihan Lokey’s only opinion is the opinion, if any,
that is actually delivered to the Committee. In preparing the materials Houlihan Lokey has acted as an independent contractor and nothing in the materials is intended to create or shall be construed as creating a fiduciary or other relationship between Houlihan Lokey and any party. The
materials may not reflect information known to other professionals in
other business areas of Houlihan Lokey and its affiliates. The preparation of the materials was a complex process involving quantitative and qualitative judgments and determinations with respect to the
financial, comparative and other analytic methods employed and the
adaption and application of these methods to the unique facts and circumstances presented and, therefore, is not readily susceptible to partial analysis or summary description. Furthermore, Houlihan Lokey did not attribute any particular weight to any analysis or factor considered by it,
but rather made qualitative judgments as to the significance and
relevance of each analysis and factor. Each analytical technique has inherent strengths and weaknesses, and the nature of the available information may further affect the value of particular techniques. Accordingly, the analyses contained in the materials must be considered as a
whole. Selecting portions of the analyses, analytic methods and factors
without considering all analyses and factors could create a misleading or incomplete view. The materials reflect judgments and assumptions with regard to industry performance, general business, economic, regulatory, market and financial conditions and other matters, many
of which are beyond the control of the participants in the Stock Splits.
Any estimates of value contained in the materials are not necessarily indicative of actual value or predictive of future results or values, which may be significantly more or less favorable. Any analyses relating to the value of assets, businesses or securities do not purport to be
appraisals or to reflect the prices at which any assets, businesses or
securities may actually be sold. The materials do not constitute a valuation opinion or credit rating. The materials do not address the fairness of any portion or aspect of the Stock Splits to any party.
|
 CONFIDENTIAL - PRELIMINARY DRAFT - SUBJECT TO FURTHER REVIEW Disclaimer (cont.)
33 All budgets, projections, estimates, financial analyses, reports and other information with respect to operations (including estimates of
potential cost savings and expenses) reflected in the materials have been
prepared by management of the relevant party or are derived from such budgets, projections, estimates, financial analyses, reports and other information or from other sources, which involve numerous and significant subjective determinations made by management of the relevant party
and/or which such management has reviewed and found reasonable. The
budgets, projections and estimates (including, without limitation, estimates of potential cost savings and synergies) contained in the materials may or may not be achieved and differences between projected results and those actually achieved may be material. Houlihan Lokey has
relied upon representations made by management of the Company that such
budgets, projections and estimates have been reasonably prepared in good faith on bases reflecting the best currently available estimates and judgments of such management (or, with respect to information obtained from public sources, represent reasonable estimates), and
Houlihan Lokey expresses no opinion with respect to such budgets,
projections or estimates or the assumptions on which they are based. The scope of the financial analysis contained herein is based on discussions with the Company (including, without limitation, regarding the methodologies to be utilized), and Houlihan Lokey does not make any
representation, express or implied, as to the sufficiency or adequacy of
such financial analysis or the scope thereof for any particular purpose. Houlihan Lokey has assumed and relied upon the accuracy and completeness of the financial and other information provided to, discussed with or
reviewed by it without (and without assuming responsibility for)
independent verification of such information, makes no representation or warranty (express or implied) in respect of the accuracy or completeness of such information and has further relied upon the assurances of the Company that it is not aware of any facts or circumstances
that would make such information inaccurate or misleading. In addition,
Houlihan Lokey has relied upon and assumed, without independent verification, that there has been no change in the business, assets, liabilities, financial condition, results of operations, cash flows or prospects of the Company or any other participant in the Stock Splits
since the respective dates of the most recent financial statements and
other information, financial or otherwise, provided to, discussed with or reviewed by Houlihan Lokey that would be material to its analyses, and that the final forms of any draft documents reviewed by Houlihan Lokey will not differ in any material respect from such draft documents. The materials are not an offer to sell or a solicitation of an indication of interest to purchase any security, option, commodity, future, loan
or currency. The materials do not constitute a commitment by Houlihan
Lokey or any of its affiliates to underwrite, subscribe for or place any securities, to extend or arrange credit, or to provide any other services. In the ordinary course of business, certain of Houlihan Lokey’s affiliates and employees, as well as investment funds in which they may have
financial interests or with which they may co-invest, may acquire,
hold or sell, long or short positions, or trade or otherwise effect transactions, in debt, equity, and other securities and financial instruments (including loans and other obligations) of, or investments in, the Company, any Stock Splits counterparty, any other Stock Splits participant, any other
financially interested party with respect to any transaction, other
entities or parties that are mentioned in the materials, or any of the foregoing entities’ or parties’ respective affiliates, subsidiaries, investment funds, portfolio companies and representatives (collectively, the “Interested Parties”), or any currency or commodity that may be involved in
the Stock Splits. Houlihan Lokey provides mergers and acquisitions,
restructuring and other advisory and consulting services to clients, which may have in the past included, or may currently or in the future include, one or more Interested Parties, for which services Houlihan Lokey has received, and may receive, compensation. Although Houlihan Lokey in the course of
such activities and relationships or otherwise may have acquired, or may
in the future acquire, information about one or more Interested Parties or the Stock Splits, or that otherwise may be of interest to the Board, the Committee, or the Company, Houlihan Lokey shall have no obligation to, and may not be contractually permitted to,
disclose such information, or the fact that Houlihan Lokey is in
possession of such information, to the Board, the Committee, or the Company or to use such information on behalf of the Board, the Committee, or the Company. Houlihan Lokey’s personnel may make statements or provide advice that is contrary to information contained in the materials. |
 |